atk:plt脚本与应用实践
这是本文档旧的修订版!
plt 作图脚本与应用实践
使用 QuantumATK 作图时可以在Virtual NanoLab上通过鼠标操作对作图进行定制并导出需要的图片格式。从2017版开始,用户可以将二维数据作图保存成plt脚本(实际为python语言脚本),这样做有很多好处:
- 可以保存用户自己设置的自定义图像,下次直接打开,不用再重新设置;也便于与同事共享相关的数据;
- 可以对数据进行导出、修改等操作;
- 可以进一步通过plt脚本定制更复杂的二维作图,直接得到符合千差万别的期刊要求的图像。
保存plt脚本
目前ATK支持以下几种作图保存plt脚本:
- 能带:BandStructure
- 投影能带:FatBandStructure
- 投影态密度:ProjectedDensityOfStates
- 以及它们的组合作图。
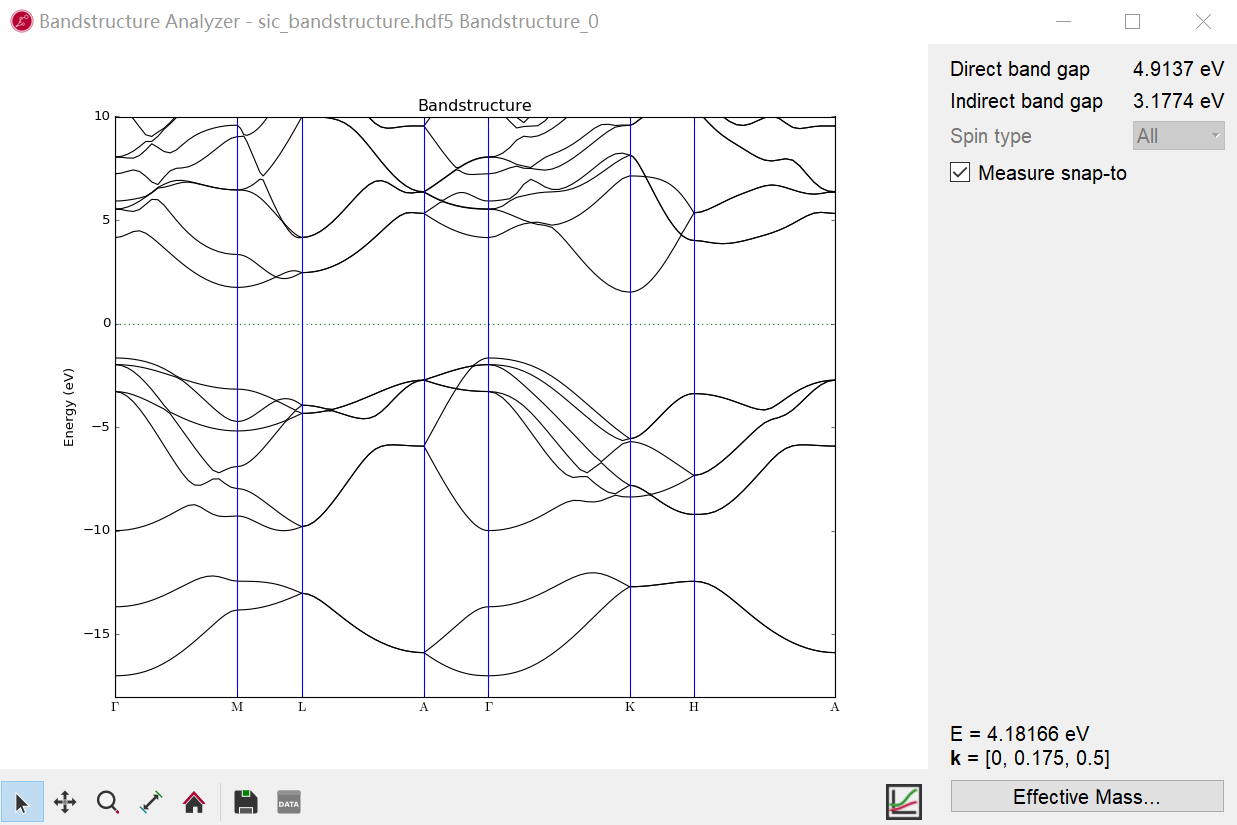
方法:在充分使用作图窗口定制图像后,点击作图窗口下方的“磁盘”按钮即可默认保存plt文件。
将plt文件重新作图
plt文件保存了用户设定的全部作图信息,用户随时可以将plt脚本重新作图查看。
方法有如下两种:
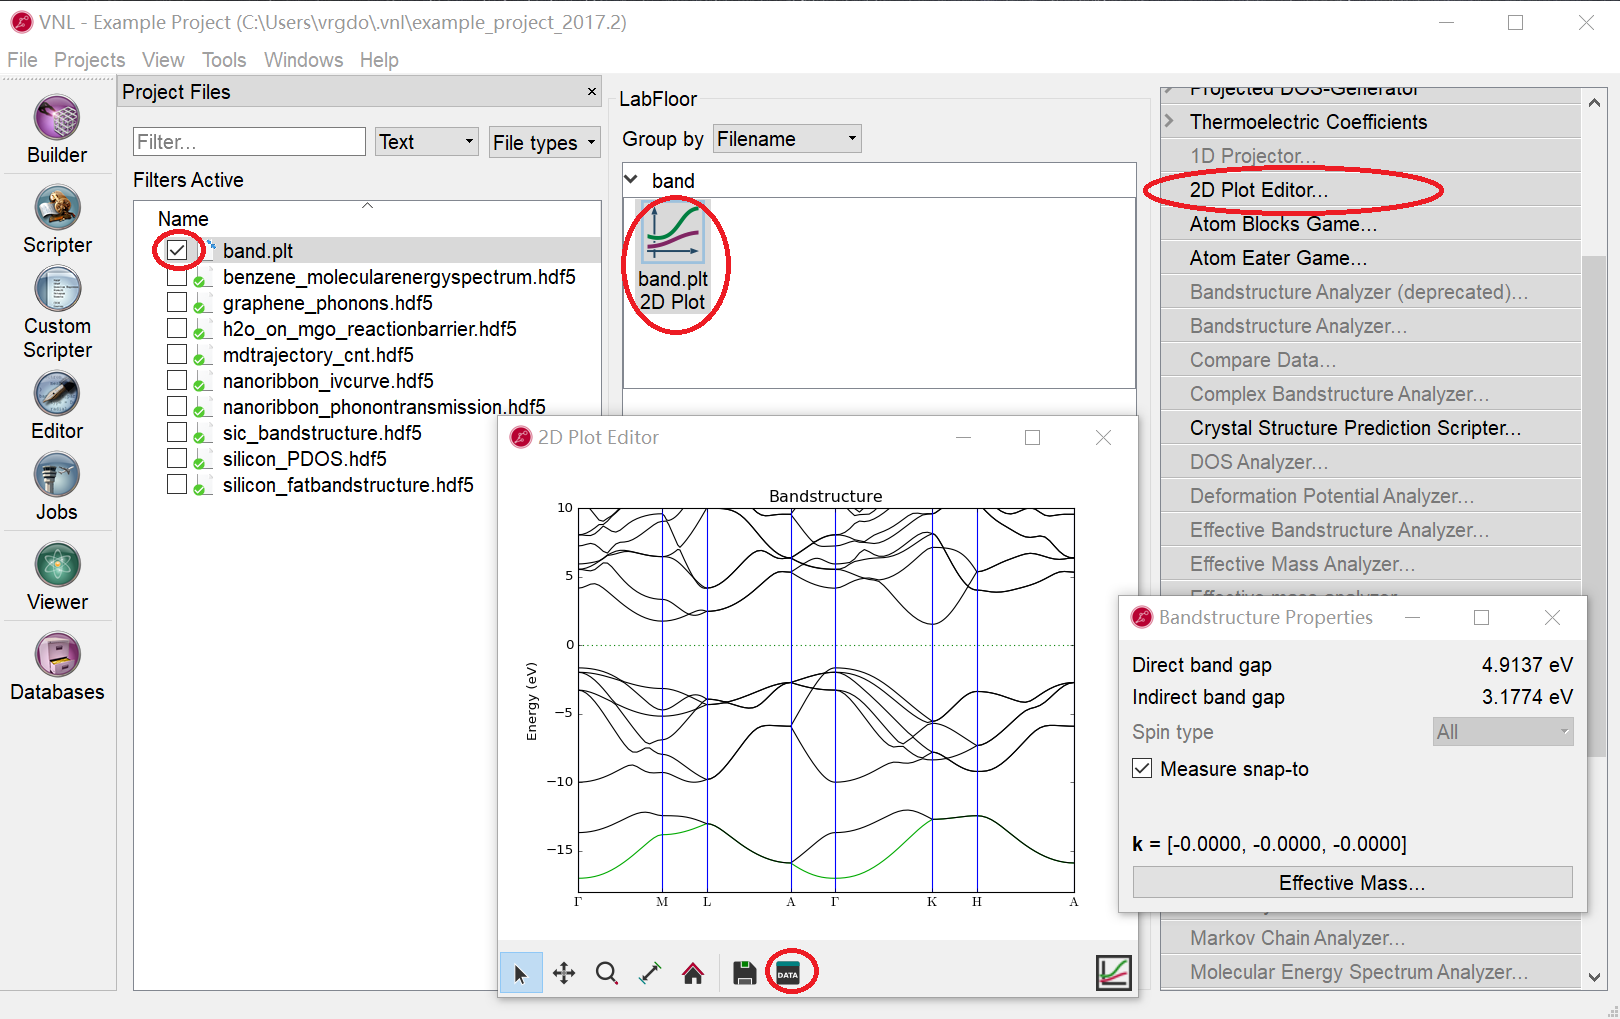
- 使用2D plot editor:在 Project Files 勾选 plt 文件,在 LabFloor 里选中 plt 数据,点击右侧 2D plot editor 即可打开作图,点击下方 Data 按钮即可查看相关的信息。
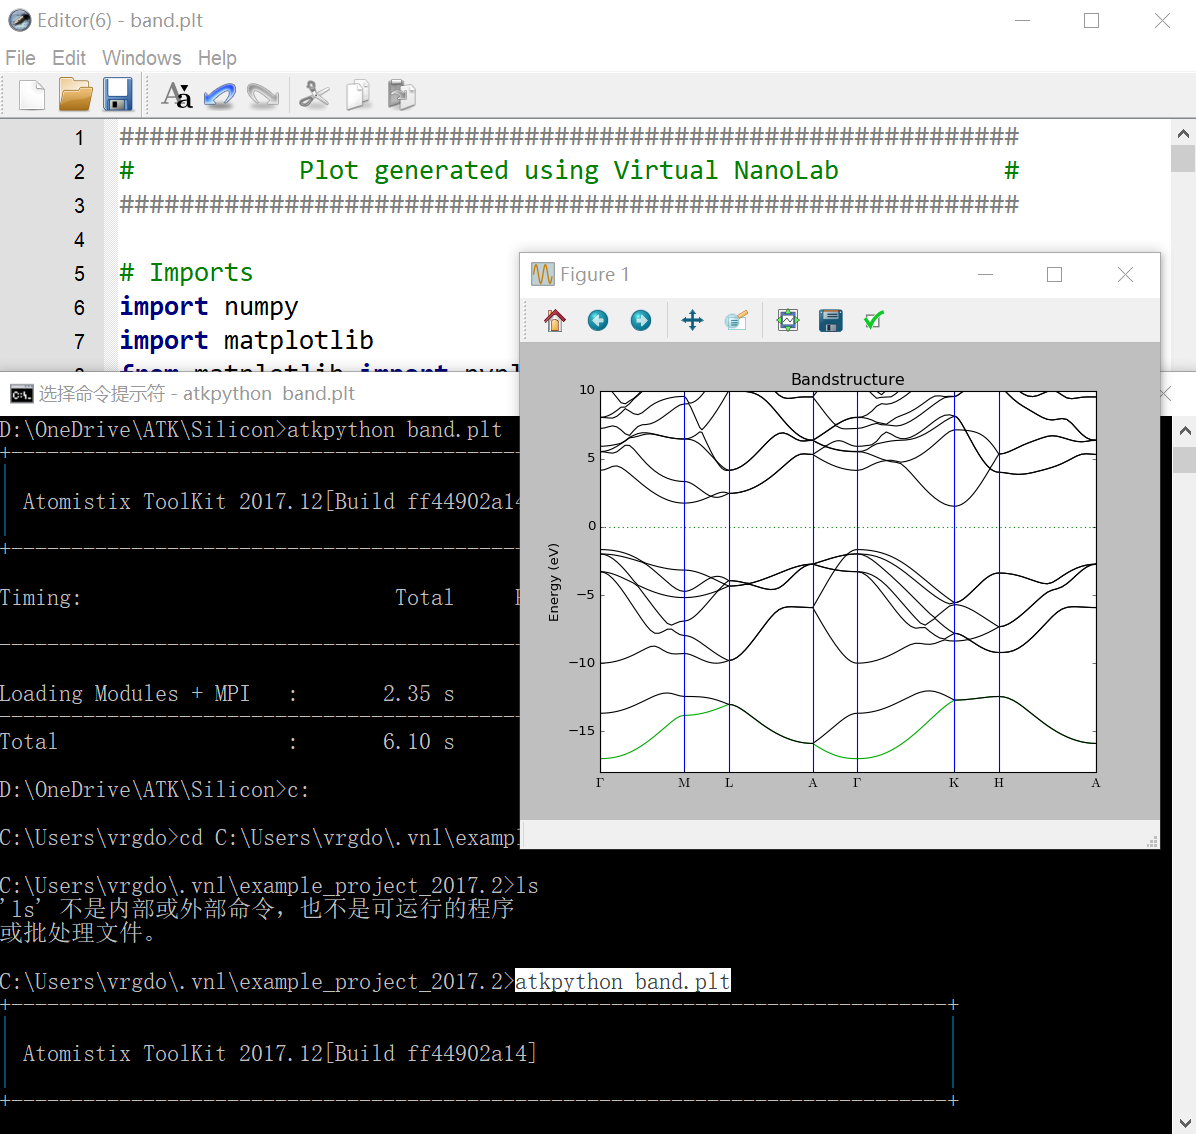
- 使用atkpython命令行:打开Windows cmd窗口,进入Project文件夹,用命令
atkpython band.plt,即可重新作图。作图后可以进一步调整图像属性,导出图片格式文件。
plt 脚本的含义
plt脚本就是matplotlib作图脚本,下面以能带图为例予以说明。
############################################################
#           Plot generated using Virtual NanoLab           #
############################################################

# Imports
import numpy
import matplotlib
from matplotlib import pyplot
from matplotlib import gridspec

# ----------------------------------------------------------
# Setup plot
# ----------------------------------------------------------
figure = pyplot.figure()
grid_spec = gridspec.GridSpec(nrows=1, ncols=1) # 有几幅小图(Subplot),如何排列

#以下逐一定义小图(Subplot)
# ----------------------------------------------------------
# Subplot 0
# ----------------------------------------------------------
axes_0 = figure.add_subplot(grid_spec[0:1, 0:1])
axes_0.set_title(u'Bandstructure')  # 作图标题
axes_0.set_visible(True)

# x-axis 横轴属性
axes_0.set_xlabel(u'') # 横轴标题
axes_0.set_xlim(0.0, 1.0) #横轴的范围
axes_0.set_xscale(u'linear') # 横轴属性
axes_0.set_xticks([0.0, ..., 0.9999999850988388]) # 横轴标识位置
axes_0.set_xticklabels([u'$\\mathrm{\\Gamma}$', ..., u'$\\mathrm{A}$']) # 横轴标识,支持LaTeX

# y-axis
axes_0.set_ylabel(u'Energy (eV)') # 纵轴名称
axes_0.set_ylim(-18.005308263554813, 10.0) #纵轴范围
axes_0.set_yscale(u'linear') # 纵轴属性

# 以下是所有的数据线

# Line
# 第1条线的x轴数据
x = numpy.array([ 0.            ,  0.008485305964,  0.016970611928,  0.025455917892,
                  ... ...
                  1.            ])
# 第1条线的y轴数据
y = numpy.array([-17.005308263555, -16.997492445781, -16.973663219783,
                 ... ...
                 -15.889060254093])
line = axes_0.plot(x, y)
line = line[0]

#第1条线的特性
line.set_visible(True)
line.set_label(u'Band 00') # 数据线的标识名称
line.set_color((0.0, 0.6666666666666666, 0.0)) # 颜色
line.set_linestyle(u'-')   # 线型
line.set_linewidth(1.0)    # 粗细
line.set_marker(None)   # 数据点标识
line.set_markeredgecolor(u'k')  # 数据点标识外缘颜色
line.set_markerfacecolor(u'k')  # 数据点标识填充颜色

#第2条线
# Line
... ...

... ...

# 第n条线
# Line
... ...


# HorizontalLine  # 作一条横线,对于能带图是费米能级位置
y = 0.0  # 横线位置
line = axes_0.axhline(y)

line.set_visible(True)
line.set_label(u'Fermi level') # 横线标识名称
line.set_color(u'green')  # 颜色
line.set_linestyle(u':')  # 线型
line.set_linewidth(1.0)   # 粗细
line.set_marker(None)
line.set_markeredgecolor(u'k')
line.set_markerfacecolor(u'k')

# VerticalLine  # 作纵线,对于能带图是布里渊区高对称点间的分隔线
x = 0.0  # 纵线位置
line = axes_0.axvline(x)

line.set_visible(True)
line.set_label(u'Gamma segment')  # 纵线标识名称
line.set_color(u'blue')  # 颜色
line.set_linestyle(u'-') # 线型
line.set_linewidth(1.0)  # 粗细
line.set_marker(None)
line.set_markeredgecolor(u'k')
line.set_markerfacecolor(u'k')

# VerticalLine
... ...
# VerticalLine
... ...

... ...


# ----------------------------------------------------------
# Show the plot
# ----------------------------------------------------------
pyplot.show()
使用plt脚本定制图像
定义颜色
常见的颜色定义方法有:
- 以下单个字母:'b'(blue), 'g'(green), 'r'(red), 'c'(cyan), 'm'(magenta), 'y'(yellow), 'k'(black), 'w'(white);
- X11/CSS4 颜色英文名,参见:https://en.wikipedia.org/wiki/X11_color_names;
- xkcd 颜色英文名, (例如, 'xkcd:sky blue'),参见:https://xkcd.com/color/rgb/;
- 16进制 RGB 或 RGBA 字符串 (e.g., '#0F0F0F' or '#0F0F0F0F');
- RGB 或 RGBA 的数值 [0, 1] (例如, (0.1, 0.2, 0.5) or (0.1, 0.2, 0.5, 0.3));
定义字体
matplotlib使用dictionary定义字体,例如可以将下面定义添加于脚本开头的部分的imports之后,setup plot之前,以供后面使用。
fontdd = {'family' : 'serif',
        'color'  : 'red',
        'weight' : 'normal',
        'variant': 'normal',
        'size'   : 20,
        }
可选项:
- family: 可使用的名称有 ‘serif’, ‘sans-serif’, ‘cursive’, ‘fantasy’, or ‘monospace’ (这些字体的实际效果依赖于系统环境);还可以直接使用操作系统的字体名称,例如:‘Arial’,‘Courier New’,‘Times New Roman’等等。
- style: 可选 ‘normal’, ‘italic’ or ‘oblique’;
- variant: 可选 ‘normal’ or ‘small-caps’;
- stretch: 可选 0-1000 数值或以下字符串 ‘ultra-condensed’, ‘extra-condensed’, ‘condensed’, ‘semi-condensed’, ‘normal’, ‘semi-expanded’, ‘expanded’, ‘extra-expanded’ or ‘ultra-expanded’;
- weight: 可选 0-1000 的数值或者以下字符串 ‘ultralight’, ‘light’, ‘normal’, ‘regular’, ‘book’, ‘medium’, ‘roman’, ‘semibold’, ‘demibold’, ‘demi’, ‘bold’, ‘heavy’, ‘extra bold’, ‘black’;
- size: 可选绝对字体大小(例如 20)或以下字符串 ‘xx-small’, ‘x-small’, ‘small’, ‘medium’, ‘large’, ‘x-large’, ‘xx-large’。
图片标题
图片标题可以在保存plt脚本前在作图上直接修改。也可以在脚本中找到如下语句:
axes_0.set_title(u'Bandstructure')
修改引号内的文字即可自定义标题。还可以增加字体、定位等,例如:
axes_0.set_title(u'Bandstructure of Silicon', fontdict=fontdd, loc='right')
绘图尺寸、精度
找到开头的pyplot一句,可控制绘图尺寸、精度和颜色。这个选项仅影响图形显示,最后导出时,依赖于实际的缩放。
figure = pyplot.figure(figsize=(4,3), dpi=150, facecolor="yellow")
坐标轴
以y轴为例,找到
axes_0.set_ylabel(u'Energy (eV)')
axes_0.set_ylim(-12.969271600563211, 10.0)
axes_0.set_yscale(u'linear')
修改其中的相关选项,即可定制y轴特性。例如:
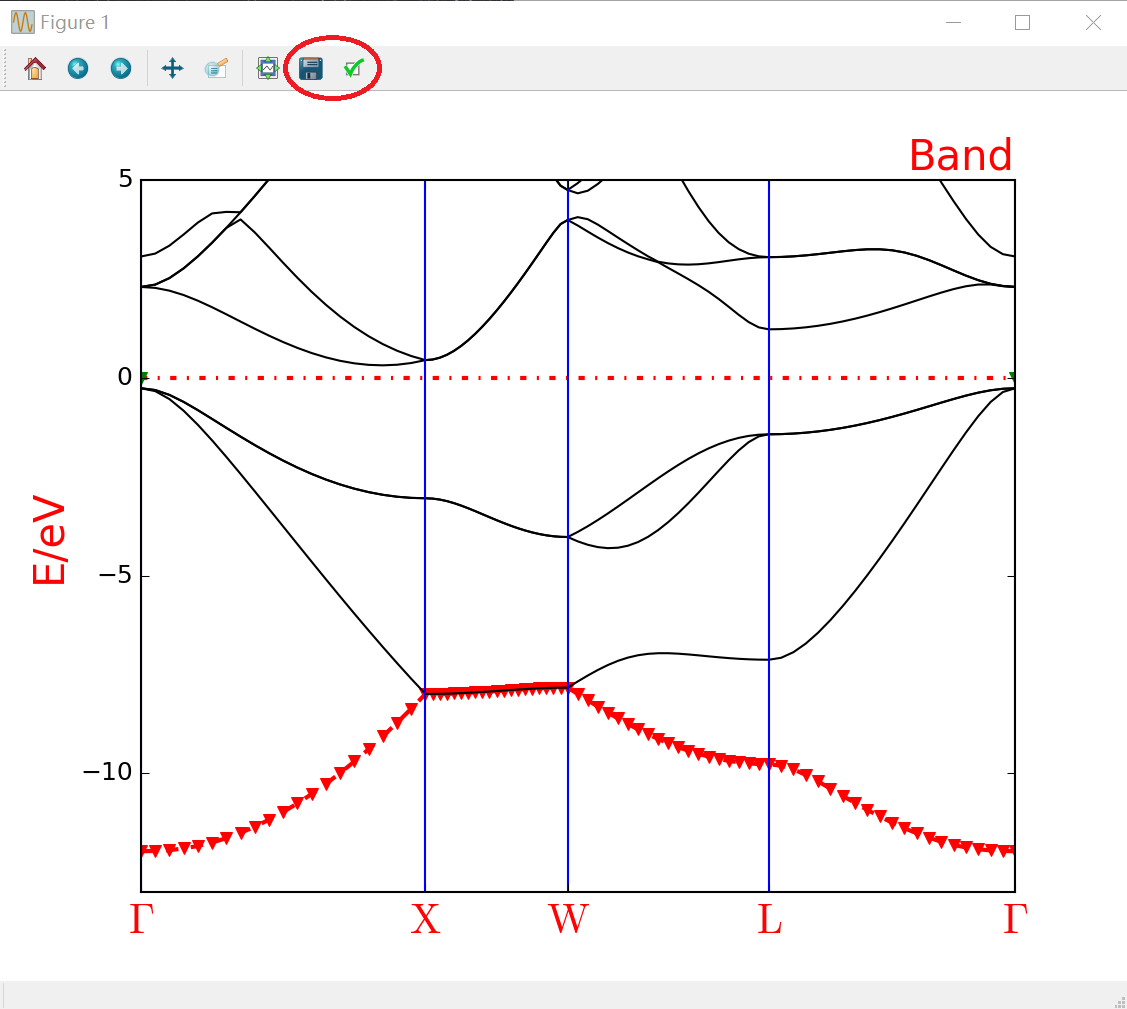
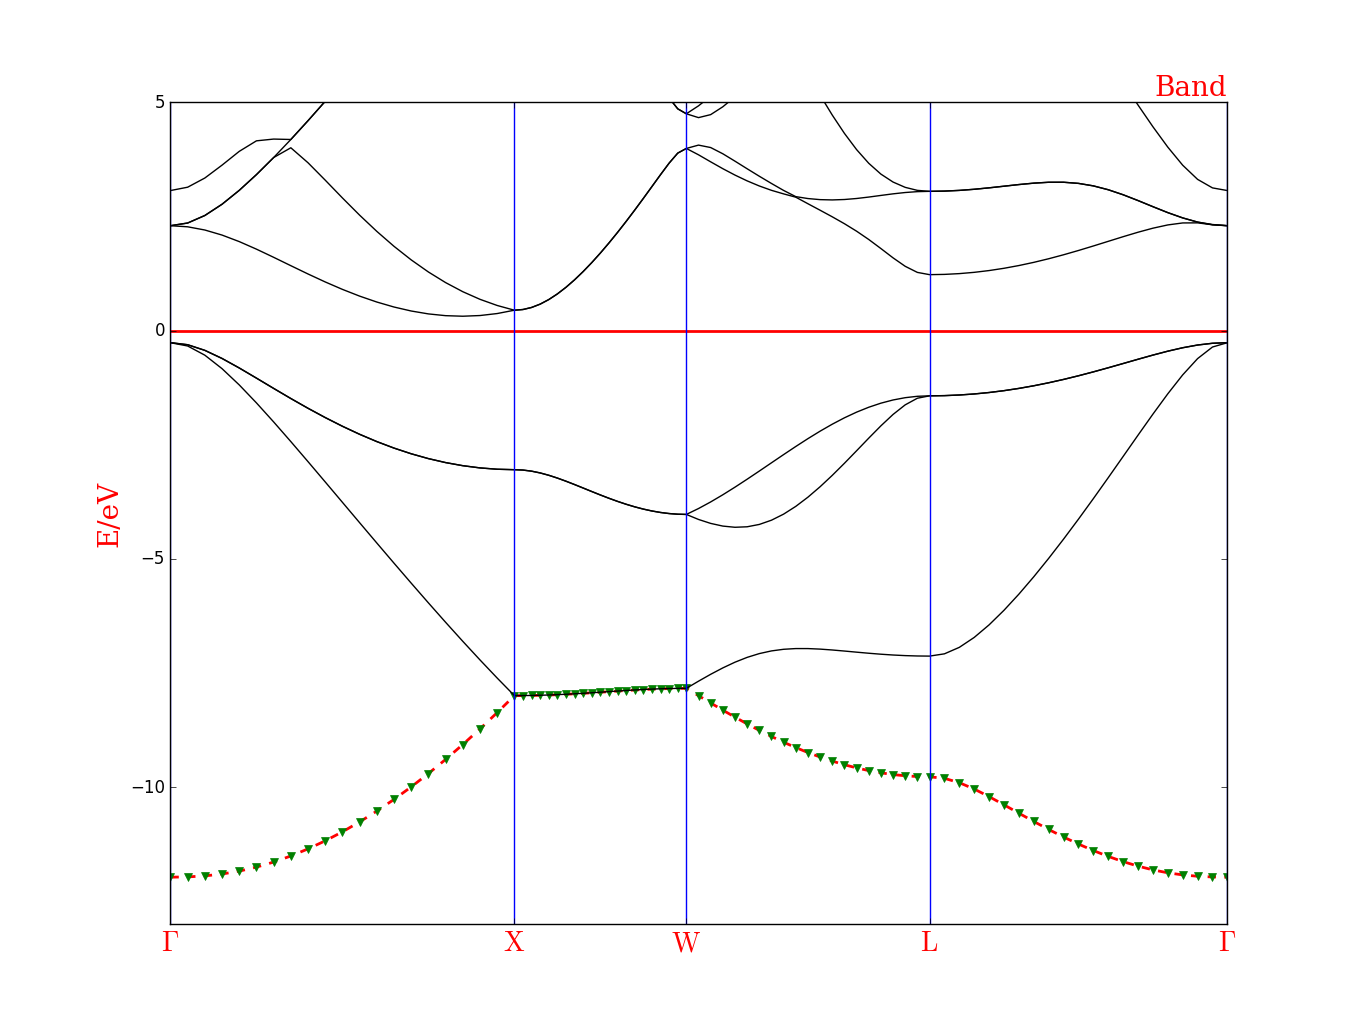
axes_0.set_ylabel(u'E/eV',fontdict=fontdd)
axes_0.set_ylim(-13, 5.0)
axes_0.set_yscale(u'linear')
数据线
line.set_visible(True)
line.set_label(u'Band 00')
line.set_color(u'red')
line.set_linestyle(u'--')
line.set_linewidth(2.0)
line.set_marker("v")
line.set_markeredgecolor(u'g')
line.set_markerfacecolor(u'g')
线型(line style)定义
| '-' or 'solid' | solid line |
| '–'(双短线) or 'dashed' | dashed line |
| '-.' or 'dashdot' | dash-dotted line |
| ':' or 'dotted' | dotted line |
| 'None' | draw nothing |
| ' ' | draw nothing |
| '' | draw nothing |
marker形状定义
种类繁多,定义请参考:https://matplotlib.org/api/markers_api.html
横线和纵线
与数据线定义方法相同。
# HorizontalLine
y = 0.0
line = axes_0.axhline(y)

line.set_visible(True)
line.set_label(u'Fermi level')
line.set_color(u'red')
line.set_linestyle(u'-')
line.set_linewidth(2.0)
进一步加工和导出
atk/plt脚本与应用实践.1523666655.txt.gz · 最后更改: 2018/04/14 08:44 由 fermi

